Some geekery: The math behind Rock, Paper, Scissors, Lizard, Spock

Okay, so my kids love Rock paper scissors. I have always admired the circularity of the game in that everything gets beaten and beats the same amount of things. I also am a bit of a trekkie and was both intrigued and delighted when I came across The Lizard-Spock Expansion (cf. The Big Bang Theory).

So what has this to do with mathematics? On this link, Mathematician Alan Yuille explains the mathematics behind the game. That aside, there is also a great explanation of the rules of the expanded form and a link to when the five-item variant made its first appearance in 2008, in an episode entitled, “The Lizard-Spock Expansion.”

Just for fun: Donald Duck in Mathmagic Land

There is a lot more to mathematics than just numbers and equations argues the narrator to Donald Duck in Mathmagic Land. Donald Duck from 1959 brings us on a journey to ancient Greece, examines musical scales, the golden rectangle and its influence in art and architecture. Some really nice examples of the way mathematics is important in our daily lives – worth a look if you don’t know the relationship between a microscope lens and a sphere (fast forward to 23 mins)!

Data visualizations: Using graphics to visualize …

There are some really great new ways to visualize data which reveal insights into the world of data which ‘wordy’ descriptions cannot match. One of recent new indulgences is to visit the site at Visual.ly which serves as an online portfolio for designers of visualizations. Here is a nice infographic from the people at visually. If the world were a village of 100 people, their ethnicities would be broken down like this:

Browse more data visualizations.


Just for fun: Sketching idioms

Graphically representing idioms …. how creative! Check out some others at visual.ly or create your own.

Does performance-based pay improve teaching?

This interesting analysis from PISA in Focus on teacher pay and kid performance reveals, once again, the complexity of education systems. Moreover, it reveals the importance of carefully parsing out data. The overall picture shows no relationship between average student performance in a country and the use of performance-based pay schemes. However, in countries where teacher pay is relatively low the data indicate that student performance tends to be better when performance-based pay systems are in place. Interestingly, if teachers are well paid the opposite is true.

Visualizing global trends using graphs: don’t miss this one!

Hans Rosling does his magic with graphical representations. In this video clip he shows how new ways of representing data can provide valuable insights into changes in data over time. He also challenges ways we think about global trends and developments and provides interesting insights to account for some of the patterns in health and economics that are made vivid from the representations.

If you are in any way interested in graphical representations or in global trends in health and economics you won’t be disappointed. A great resource to use for introductory statistics (at any level) and a superb way to demonstrate that a picture can reveal insights far beyond the capabilities of descriptive statistics.

Messy data and thinking about variation

This presentation by Tim Erickson at CMC-North Ignite brings some really salient points to light when speaking about helping learners engage with data. Some really interesting tidbits and lots of laughs. Variability, large data set, rich data and kids thinking …..

Thinking about size: Just how small is an atom?

A great way to visualize size ….. from TEDeducation

Primary mathematics – when do we know we got it ‘right’?

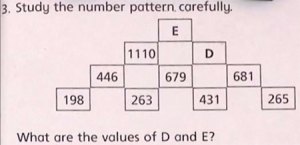
There is a lot of cyber discussion about the article ‘Singapore maths questions leave adults stumped’ published on Edvantage. Adults are presented with three maths problems from primary level 3 maths books and asked to solve them. Most adults shown are shocked at the difficulty level of the problems for young children. If you watch the second video on the website we can see a primary level girl solving a complex number pattern activity. The video leaves me perturbed. Is this mathematics? Is it problem solving? Recognizing patterns? Or is it just that this child has a number of tools at her disposal to decode such problems – or are they ‘tricks’?

What I can say with certainty is that there is little chance of challenge of this (or any) sort being presented in an Irish primary level mathematics text book. Our text book publishers have a different philosophy when it comes to primary years mathematics education. No complicated questions that challenge children; no complicated questions that might invoke maths anxiety. Nope. Our 8 year old children are still colouring in pictures of the seasons in their maths books. And it isn’t even colour-by-number.

Learning from video games

I think my first real interest in mathematics came from playing games on the old BBC microcomputer (built by Acorn Computers for the BBC Computer Literacy Project). As kids we learned about angles and velocity by trying to blast cannonballs against a mountain side. I also remember spending hours trying to get the turtle (on LOGO) make a circle and using the repeat function to make patterns. I never did make the circle until many years later …. In fact, a recent article in the observer argues that The BBC Micro can still teach us a lot

The LOGO turtle now really looks like a turtle (as opposed to the triangle I remember) and the NCTM illuminations version has obstacles to avoid and other kiddie friendly features. There is a nice article at The Innovative Educator which provides a quick update on the possibilities of ‘new generation’ gaming for learning.